

Direct answer. A well-structured rental property should ideally produce durable cash flow while also building long-term wealth. But those are two different measurements. Cash flow shows what the property puts into, or takes out of, the owner's bank account today. Wealth creation can also come from mortgage principal reduction, appreciation, future rent growth, and the property's after-tax economics.
For Richmond rental owners, the better question is whether the property is doing the financial job it was chosen to do. PMI James River's owner resources are built around that longer view, while a realistic Richmond rental property budget establishes what the property actually needs to support before an owner decides whether its performance is good or bad.
Key Takeaways
- A strong rental should ideally support its operating costs, reserves, and financing while producing sustainable cash flow.
- Cash flow is only one part of investment return. Principal paydown, appreciation, future rent growth, and tax treatment can also build wealth.
- The principal portion of a mortgage payment reduces cash today, but it also reduces debt and increases owner equity.
- Depreciation can materially affect a rental property's after-tax economics, but the actual benefit depends on the owner's tax circumstances. A qualified tax advisor should calculate it.
- "The rent does not cover my mortgage" identifies a cash-flow condition. It does not, by itself, answer whether the property is increasing or decreasing the owner's wealth.
Cash Flow and Wealth Measure Different Things
Cash flow answers a short-term question: after rent comes in and the property's current obligations go out, how much money is left?
For a financed rental, that means looking at rent after management, taxes, insurance, repairs, reserves, debt service, and other property costs. Positive cash flow has real value. It can provide current income, build liquidity, fund another acquisition, or give the property more room to absorb an expensive month.
Wealth answers a broader question: how did the owner's financial position change?
A rental can build wealth through several channels:
- Cash flow: money the owner can retain, spend, or reinvest.
- Principal reduction: mortgage debt that is gradually converted into owner equity.
- Appreciation: increases in property value, although future appreciation is never guaranteed.
- Rent growth: market-supported increases in future rental income.
- Leverage: the ability to control a larger asset with less owner cash invested.
- Tax treatment: deductible expenses and depreciation that may improve the owner's after-tax result.
Leverage is one reason these two scoreboards can diverge. Suppose an investor purchases a $300,000 rental with $60,000 down and finances $240,000. A 3% increase in the property's value over year one is $9,000. That bonus money in the pocket" equals 15% of the original $60,000 down payment before financing costs, taxes, operating results, selling costs, or other return components are considered. The mechanics deserve their own analysis, which is why PMI James River addresses them separately in Rental Property Leverage Explained.
Richmond's recent history also shows why appreciation belongs in the conversation without becoming the investment thesis. The Federal Housing Finance Agency's 2026 Q2 all-transactions House Price Index shows Richmond, VA at 3.37% appreciation over one year and 47.68% over five years. Translated into simple terms, the average Richmond has doubled in value every decade. That benefit must be accounted for when looking at a rental's overall performance. Disclaimer: the FHFA metropolitan house price data is historical evidence, not a forecast for a particular rental.
Principal Paydown Is Money in a Different Pocket
One of the easiest parts of rental-property finance to overlook is the difference between mortgage principal and an operating expense.
The full principal-and-interest mortgage payment reduces the cash available to the owner. But the two parts of that payment do very different things. Interest is the cost of borrowing. Principal reduces the outstanding debt and increases the owner's equity.
Principal is money moving to a different pocket.
If $200 of a mortgage payment goes toward principal, the owner has $200 less cash available today. But the mortgage balance also falls by $200, increasing owner equity by the same amount before any change in property value. Principal therefore counts when calculating cash flow after debt service, but it should not be treated like a lost operating expense when evaluating total return.
The Consumer Financial Protection Bureau's mortgage guidance explains the same distinction: the principal portion reduces the amount owed and builds equity, while interest does not reduce the loan balance.
Tax Planning Belongs in the Investment Analysis
Tax treatment is another reason the monthly owner distribution is an incomplete scoreboard.
The IRS Residential Rental Property guidance explains rental income, deductible expenses, basis, and depreciation. Under the general depreciation system, qualifying residential rental buildings and structural components generally use a 27.5-year recovery period. Land itself is not depreciable.
That matters because depreciation can reduce taxable rental income without requiring a matching current-year cash payment. Mortgage interest may also qualify as a rental expense under the applicable rules, while principal serves a different economic function by reducing debt.
A simple depreciation example:
Assume a $300,000 rental property where $60,000 of the purchase basis is allocated to land and $240,000 is allocated to the depreciable building. For a full tax year under the 27.5-year general depreciation system, the building could generate about $8,727 of annual depreciation.
Now assume the property has $10,000 of taxable rental income before depreciation. Applying the $8,727 depreciation deduction would reduce that taxable rental income to about $1,273.
At a hypothetical 24% federal marginal tax rate, that $8,727 deduction could represent about $2,095 less federal income tax on that rental income, assuming the deduction is currently usable. Importantly, the owner did not have to spend another $8,727 in cash that year to create the depreciation deduction.
That is one reason cash flow and after-tax return can look very different. A property might put only a modest amount of cash into the owner's bank account while depreciation reduces the amount of rental income subject to current federal income tax.
The tax result is not identical for every investor. If depreciation and other deductions push the rental into a tax loss, passive-activity rules can affect whether that loss can be used immediately or is limited for the current year. That is why PMI James River strongly recommends that rental owners work with a qualified tax advisor or CPA to determine depreciable basis, allowable deductions, passive-loss treatment, and the property's actual after-tax return.
An owner who evaluates the investment without understanding depreciation and the applicable tax treatment may be leaving an important part of the real estate return completely out of the analysis.
High Cash Flow Still Has to Be Real
None of this makes cash flow unimportant. A cash-flow-first property has a legitimate job: produce usable income while remaining properly funded.
The problem comes when the apparent monthly surplus ignores costs that simply have not arrived yet.
Rental expenses are uneven. An HVAC replacement, turnover, vacancy, insurance adjustment, water heater, plumbing repair, or larger capital project can consume many months of apparent profit at once.
PMI James River sees this as one of the easiest ways owners can misread performance. A quiet year can make a property look unusually profitable. Then several large expenses arrive close together. The expenses did not necessarily destroy a year's profit. Part of what looked like profit may actually have been reserve money that had not yet been recognized as such.
A rental that appears to produce $500 per month while reserving nothing for predictable capital needs is not automatically stronger than a rental producing $350 per month after realistic reserves.
This distinction matters across Richmond Metro because the housing stock is not uniform. An older Richmond City rental and a newer property in Henrico or Chesterfield can collect similar rent while carrying very different repair timing and capital needs. Good rental maintenance planning helps make those future cash requirements more predictable.
A Conservative Five-Year Stress Test: Flat Rent, Rising Costs, Modest Appreciation
A property that consistently requires owner contributions is not the ideal investment target. Ideally, rent covers the property's operating costs, reserves, and financing and still leaves the owner with positive cash flow.
But owners can react strongly when they see themselves adding money to a rental each month. That reaction is understandable because the cash leaving the bank account is immediate and obvious. The wealth being created elsewhere is much easier to miss.
This five-year illustration deliberately makes the cash-flow side difficult. Rent stays completely flat at $2,500 per month while non-mortgage property costs and reserves rise 3% every year. The property is assumed to appreciate by a modest 2% annually.
Year 1 in plain English:
The rental collects $2,500 per month.
Assume about $1,000 per month goes toward non-mortgage property costs and realistic reserves.
The $240,000 mortgage has a principal-and-interest payment of about $1,597 per month.
The rental therefore runs at a loss of about $97 per month, or $1,161 during the first year.
That $1,161 loss is a real cash contribution. But it is not the entire financial result. During that same year, approximately $2,438 of mortgage principal is paid down, and a 2% increase in the value of a $300,000 property would add another $6,000 of owner equity.
Depreciation adds another potential layer. Using the same illustrative $240,000 depreciable building basis discussed above, a full-year depreciation deduction would be about $8,727. At a hypothetical 24% federal marginal tax rate, that could have a current federal tax value of up to about $2,095 per year if the deduction is currently usable by that owner.
All figures below are cumulative. The point is not simply to show what the owner has paid. It is to show what may have been built at the same time.
| After | Extra Cash Owner Has Added | Principal Paid Down | Illustrative Appreciation at 2% | Potential Cumulative Federal Tax Savings From Depreciation* | Illustrative Net Economic Gain After Extra Cash* |
|---|---|---|---|---|---|
| Year 1 | $1,161 | $2,438 | $6,000 | Up to $2,095 | $9,372 |
| Year 2 | $2,682 | $5,052 | $12,120 | Up to $4,190 | $18,680 |
| Year 3 | $4,574 | $7,855 | $18,362 | Up to $6,285 | $27,928 |
| Year 4 | $6,847 | $10,861 | $24,730 | Up to $8,380 | $37,124 |
| Year 5 | $9,514 | $14,084 | $31,224 | Up to $10,475 | $46,269 |
*Illustrative purposes only. The example assumes a $300,000 property, $240,000 30-year mortgage at 7%, $2,500 monthly rent that does not increase for five years, non-mortgage property costs and reserves beginning at $1,000 per month and rising 3% annually, and 2% annual compounded appreciation. The 2% appreciation assumption is not a forecast and actual property values may rise, remain flat, or decline. The depreciation illustration assumes a $240,000 depreciable building basis, approximately $8,727 of annual depreciation, a hypothetical 24% federal marginal tax rate, and that the deduction is currently usable. Actual basis, deductions, passive-activity treatment, tax rates, sale costs, taxes on disposition, and tax results vary. The final column equals cumulative principal paydown plus modeled appreciation plus potential depreciation-related tax savings minus additional owner cash contributions. It does not represent total return on the owner's original down payment or acquisition costs. A qualified tax advisor should calculate the actual tax result.
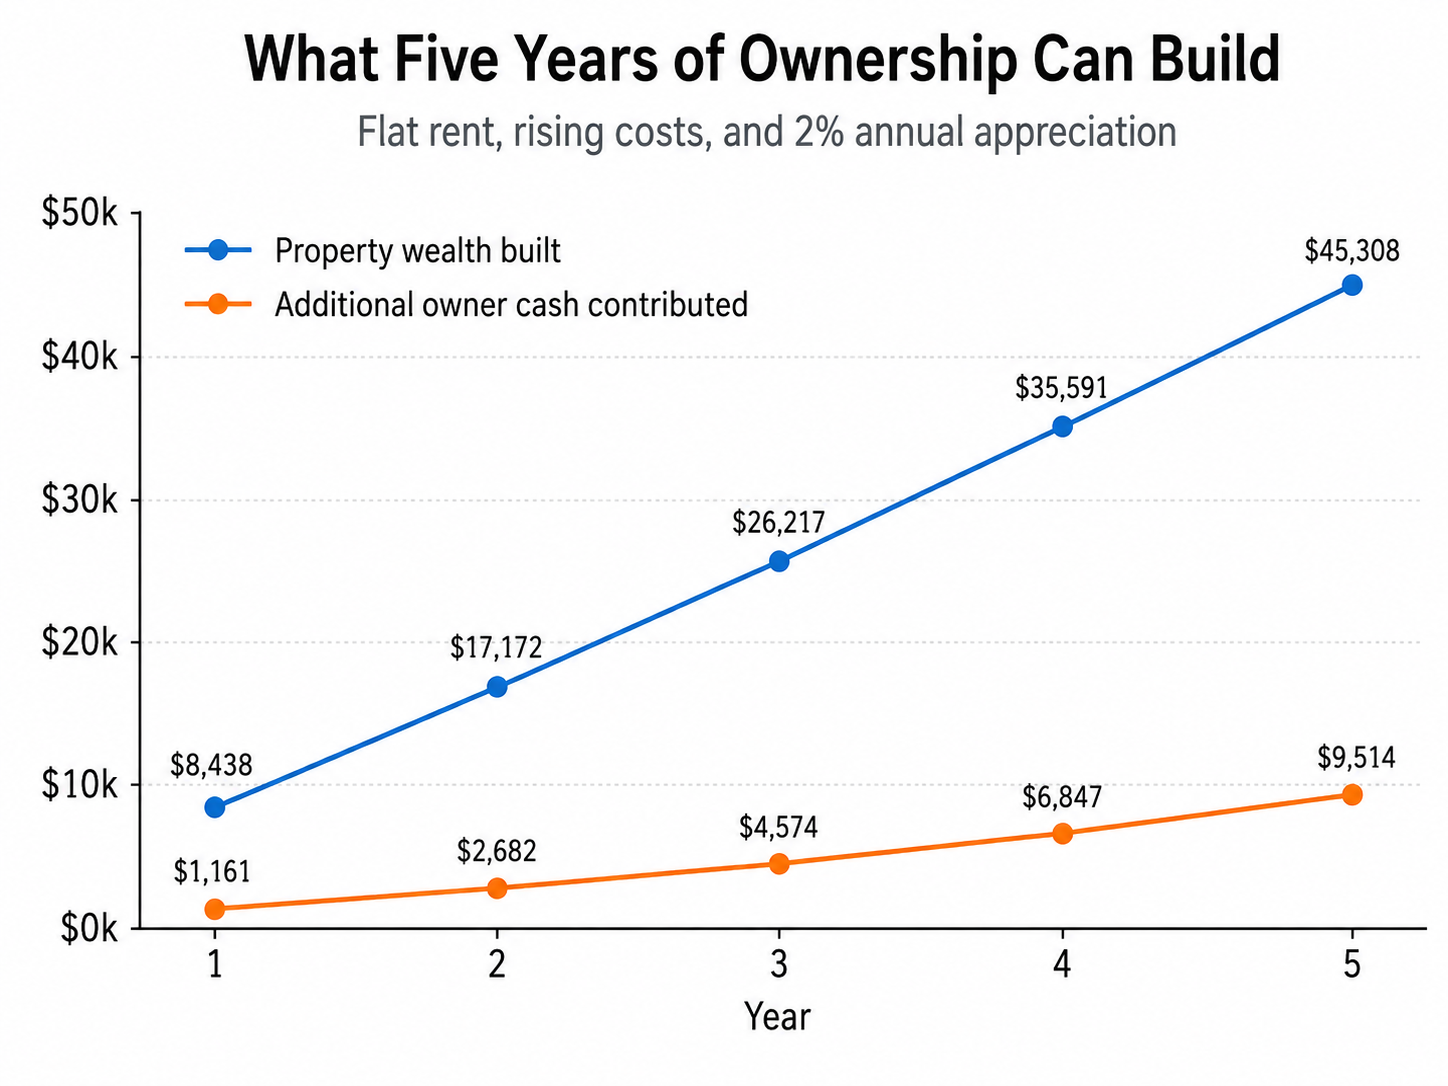
Zoom out before judging the investment by the monthly shortfall.
Over five years, the owner in this deliberately conservative example contributes about $9,514 of additional cash.
During the same period, approximately $14,084 of mortgage principal is paid down and modest 2% annual appreciation creates about $31,224 of additional property value. Together, those two sources create roughly $45,308 of additional property equity.
After subtracting the owner's $9,514 of additional cash contributions, that is approximately $35,794 of net additional wealth before counting any depreciation-related tax benefit.
If the modeled depreciation deduction is fully usable each year, its potential cumulative federal tax value could add another $10,475, bringing the illustrative five-year economic gain after those additional cash contributions to about $46,269.
This does not mean an owner should ignore negative cash flow, and it does not make every property requiring monthly contributions a good investment. The cash requirement has to fit the owner's finances and investment plan.
It does mean that looking only at the money leaving the checking account can create a badly distorted picture. In this example, the owner feels a $97 monthly shortfall in Year 1 immediately. Principal paydown, appreciation, and potential tax benefits are quieter, but over time they can be much larger than the monthly number that attracts the owner's attention.
That is why the better question is not simply, "Does the rent cover my mortgage?" It is, "After everything I have put into this property, what has it actually added to my financial position?"
Decide the Property's Job, Then Review It Annually
The right target depends on what the owner expects the property to accomplish.
An accidental landlord who bought a Henrico or Chesterfield home years ago may have a very different mortgage balance, basis, and equity position from an investor buying a similar property today. An older Richmond City rental may carry different capital needs. Two properties collecting similar rent can therefore deserve very different performance expectations.
A practical annual review should answer:
- How much usable cash did the property actually produce, or how much additional cash did the owner contribute?
- Were realistic reserves funded before the remainder was called profit?
- How much mortgage principal was paid down?
- How did the property's market value change, and what evidence supports that estimate?
- What major capital work was completed or is approaching?
- What did the owner's tax advisor determine about depreciation, deductions, passive-loss treatment, and the property's after-tax result?
- How much owner capital remains tied up in the property?
- Is the rental still serving an income, wealth-building, or balanced objective?
This is why monthly owner statements should be treated as inputs rather than the entire investment verdict. PMI James River's rental property financial management guide addresses the annual measurement process in more detail, while owner accounting and reporting keeps income, expenses, invoices, and property-level activity organized.
PMI James River's decision rule remains simple: judge the rental by the job the owner hired it to do.
If the job is current income, the property should produce durable cash flow after honest operating costs and reserves. If the job is long-term wealth, the owner should see a credible path to increasing equity, future income, and a worthwhile after-tax result. If the goal is both, the owner needs to decide what balance of current income and future growth is acceptable.
Owners should not let the sentence "the rent does not cover my mortgage" end the analysis. It deserves attention because it describes a real cash requirement. It does not, by itself, establish that the investment is losing money.
Next step: A Richmond rental analysis can establish the property's market-supported rental-income potential and provide a starting point for evaluating its cash-flow and long-term wealth profile. The tax side of that decision should be reviewed directly with a qualified tax advisor.
Published: August 7, 2026
Updated: September 1, 2026